The Cheesecake Factory Incorporated Stock Price and Value Analysis
The Cheesecake Factory Incorporated (NasdaqGS:CAKE) in our automated value investing analysis, with the cash flow history and price comparison below.
Key Facts
- Ticker: CAKE (NasdaqGS)
- Current price: $105.83
- Sector: Consumer Cyclical
- Industry: Restaurants
- Dividend yield: 1.09%
Advertisement helps keep Trendshare free for most readers.
Hold-time calculator
Estimate how long you need to hold The Cheesecake Factory Incorporated to reach your target.
CAKE Free Cash Flow Trend
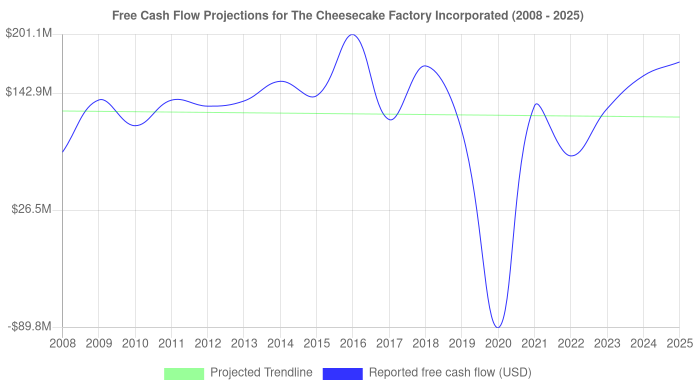
Based on historical returns, we believe that The Cheesecake Factory Incorporated can grow its free cash at a rate of about 8%. That's positive!
| Advantages | Disadvantages |
|---|---|
|
|
Inside the CAKE Numbers
| CAKE Price (The Cheesecake Factory Incorporated stock price per share) |
$105.83 | |
|
|
CAKE Fair Price (based on intrinsic value) |
$74.86 |
| CAKE Safety Price (based on a variable margin of safety) | $48.66 | |
|
Try your own return
The fair price above uses a 10.1% discount rate, the long-run US stock return (10.1% geometric, 1926 to 2025, from Bessembinder's working paper, updated 2026-11-09), and 2.5% terminal growth. A higher rate suits a higher return target and gives a lower value. Value per share: |
||
| PE Ratio versus Sector | 35% higher than other Consumer Cyclical stocks | |
| PE Ratio versus Industry | 34% higher than other Restaurants stocks | |
| Cash Yield | 3.13% | |
| Free Cash Flow Jitter | 48% | |
| Dividend Yield | 1.09% (tax impact) | Shares Shorted | 8,909,603 |
Insider Activity Summary
No open-market insider buys or sells are recorded for the last 12 months.
This stock has short interest! This means that people have shorted it.
Why does that matter? They've made a bet that price will decrease from where they bought it. Maybe there are financial problems, or maybe there's a value play.
As of the latest analysis, there are 8,909,603 shares shorted. With 45,667,805 shares available for purchase and an average trading volume over the past 10 trading days of 2,115,480, it would take at least 4.2 days for all of the short holders to cover their shorts.
Related guides: good annual rate of return · high-yield stocks · forecasting earnings growth
Free Cash Flow by Fiscal Year
Each year names the SEC filer that reported it, so a change of filer shows up here.
| Fiscal year | SEC filer (CIK) | Free cash flow (USD millions) |
|---|---|---|
| 2008 | 887596 | 84.3 |
| 2009 | 887596 | 136.1 |
| 2010 | 887596 | 110.6 |
| 2011 | 887596 | 135.9 |
| 2012 | 887596 | 129.9 |
| 2013 | 887596 | 135.1 |
| 2014 | 887596 | 154.6 |
| 2015 | 887596 | 140.3 |
| 2016 | 887596 | 201.1 |
| 2017 | 887596 | 116.6 |
| 2018 | 887596 | 169.8 |
| 2019 | 887596 | 105.3 |
| 2020 | 887596 | -89.8 |
| 2021 | 887596 | 130.1 |
| 2022 | 887596 | 80.6 |
| 2023 | 887596 | 127.4 |
| 2024 | 887596 | 160.0 |
| 2025 | 887596 | 173.8 |
Download the yearly data as CSV.
Price Versus Our Estimated Value
The Cheesecake Factory Incorporated reported positive free cash flow in 17 of the 18 fiscal years we have from its current SEC filer.
Average free cash flow over the last three years of data was $153.7 million, and across the first three years it was $110.3 million; over the period it rose sharply.
Free cash flow is volatile from year to year, with a variability measure of 48%.
At $105.83, the price is above our fair value estimate of $74.86 for The Cheesecake Factory Incorporated.
The Cheesecake Factory Incorporated pays a dividend yield of 1.09%.
Before you act on any of this, read what a margin of safety means and check the company's own filings.
Compared With Its Sector and Industry
Its trailing P/E ratio is 35% above the average for stocks in the Consumer Cyclical sector.
Its trailing P/E ratio is 34% above the average for stocks in the Restaurants industry.
A P/E ratio depends on trailing earnings, which one-time items can distort, so a lower P/E is not by itself evidence of value.
SEC Filer History
Every fiscal year on this page is reported by one SEC filer, CIK 887596.
Each figure on this page comes from that filer.
Risks to This Analysis
- Free cash flow was negative in 1 of the 18 years we have.
- Free cash flow is volatile from year to year, so the estimates depend heavily on which years are included.
- This page's data was last updated on 2026-08-04. Prices and filings may have changed since.
- These figures are automated calculations from SEC filings and the recent price. They may contain errors, and they do not reflect lawsuits, management changes, or other events the filings do not show.
Advertisement supports free stock analysis content.
Questions to Answer Before You Invest in CAKE
Does The Cheesecake Factory Incorporated have a coherent story? Does it have a plan to continue to make money? Is it worth your time? Only you can decide where to go from here. Our investment guide helps you ask the right questions, including how to buy stocks. Use these research links for more information.
Worked example: CAKE
This example shows how we apply the Trendshare checklist to CAKE: earnings power, cash generation, valuation, and margin of safety.
We check: business quality, free cash flow, P/E, and margin of safety.
-
Step 1 — Snapshot
- Price: 105.83
- Market cap: $5.3B
- EPS: 3.69
-
Step 2 — Valuation checks
- P/E: 28.68
- FCF yield: 3.1%
- Date checked: Aug 4, 2026
-
Step 3 — Margin of safety
- Compare price to fair value and safety price.
- Look for durable cash generation and reasonable leverage.
- Decide if it passes your personal checklist.
Most Popular Articles
What is Cash Return on Invested Capital?
What is Dollar Cost Averaging?
DCA vs Lump Sum: 155 Years of S&P 500 Historical Data